Debugging C code with GDB: The GNU Project Debugger
GDB (The GNU Project Debugger) is a debugging tool that I admittedly have a love/hate relationship with. On the one hand it is extremely good at what it does, while on the other hand it has a terribly frustrating learning curve. After getting through the initial 'none of this is making sense' barrier, however, using GDB is a fantastic way to learn about C, assembly, and debugging.
GDB is started from the terminal with the following syntax:
gdb (options) (filename)
To 'quietly' open a C file named 'Talisman' would require the following syntax:
gdb -q Talisman
The location of the file matters and will need to be specified if it isn't in the current working directory.
Note: if the original source code was compiled without debugging options specified, a 'no symbols' error will be presented. This means the source code is not available for viewing inside GDB, however, we can still view the assembly code.
When working with GDB there are a huge amount of commands that can be issued. GDB's complexity and sheer depth make it both terrifying and infinitely useful, depending on what you're trying to achieve. The following commands are a good step towards a basic proficiency with GDB.
Start
The start command will start the program and put a break point on the first instruction to be executed by the program.stepi
The stepi command steps through the program by a single instruction. Entering the command once and then pressing the return key will continue to step through the program instruction by instruction, until a new command is entered.step
The step command steps through the code until it steps into a function. Using this command after 'start' will take you straight to the first function called by the code.info registers
The info registers command displays the register contents for the selected stack frame. Using this command after a Segmentation Fault will show the memory address of the Instruction Pointer at that moment in time - invaluable for memory buffer overflows!info frame | frame
The info frame command will output information regarding the current stack frame, including the eip memory address and saved registers. The 'frame' command will display only the eip memory address.continue
The continue command will continue executing the program until reaching the next break or watch point. Break and watch points must be manually set before running the continue command.x | x/20x | x/20i main
The 'x' command is short for 'examine'. There are a couple of good ways to use this command. The first is 'x/20x' which will examine 20 spaces of memory addresses displayed in hexadecimal format. The second is 'x/20i' which will again display 20 spaces of memory addresses, only this time the output format will be in machine code. In both instances the number of addresses to display (20) can be changed as needed.disassemble (function)
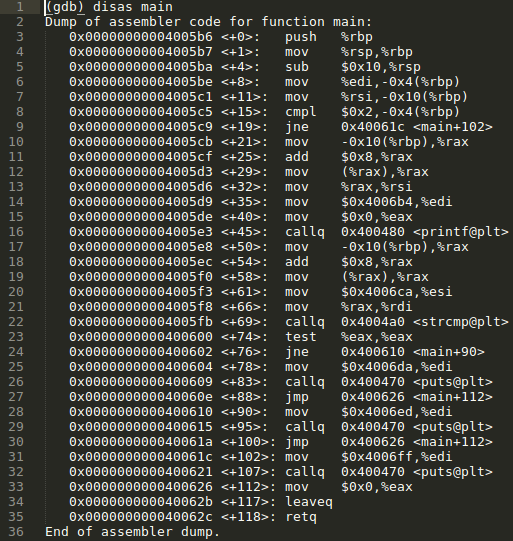
The disassemble command will show the machine code of the function that is given as an argument to the command. For instance, 'disassemble main' will display the machine code for the program's main function.kill
The kill command stops execution of the current program.quit
When you're ready to return to life outside of GDB...In the near future I will be writing about memory buffer overflows, for which GDB will prove to be a very useful tool.


Comments
Post a Comment